In the instance of debugging a for-loop, Imagine a situation where you specifically wanted to debug the fourth time it gets hit. To accomplish this, one would have to write a condition that states that if the loop is on its fourth iteration, die($info).
foreach ($arr as $k => $v {
    if ($k == 4) {
        die($v);
    }
}
In the example above, a simple condition might do the trick, but there are more complex situations where planting a breakpoint might not give you the results your looking for. Like in the situation where you may want to debug information only available at the last time a function gets hit a unknown amount of times.
How about if you only wanted to debug the third iteration? In this case you would have to save a global variable that auto increments by 1, and when it reaches a certain number then die($info).
global $it;
$it = 0;
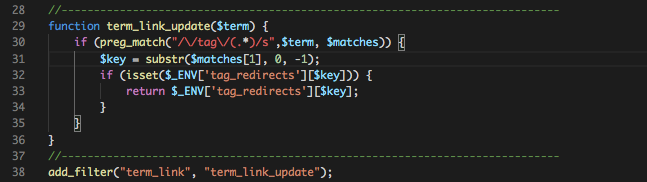
function term_link_update($term) {
global $it;
$it++;
if (preg_match("/\/tag\/(.*)/s",$term, $matches)) {
if ($it == 3) {
die($term);
}
$key = substr($matches[1], 0, -1);
if (isset($_ENV['tag_redirects'][$key])) {
return $_ENV['tag_redirects'][$key];
}
}
}
//---------------------------------------------------------
add_filter("term_link", "term_link_update");There are even more complex situations, for instance, wanting to see all results from all iterations, 1st, 2nd, 3rd and 4th. How about if I wanted to see the order in which functions are being executed, spanning across different servers and environments. Other problems also occur with how your breakpoint might be displayed after executing. All languages in my experience allow for a listener to be set passing a callback executed when the process gets killed
register_shutdown_function("output_after_your_kill_function");resulting in other things being outputted to your screen, possibly burying your output, or hiding completly off screen.
What is Tracing?
Tracing writes specific steps within the life span of the process being executed to a isolated file created within your project root, with the intent of using this information to guide you towards debugging a particular issue.
How does Tracing differ from using breakpoints?
Breakpoints kill or interrupt a process, tracing doesn’t.
Whats the difference between logging and Tracing?
Tracing is similar to logging but different in its intent. In PHP, You could debug using error_log() which outputs to a system file set aside for storing STDOUT, but if you do so, jumble your logs with everything else being logged. Also, depending on your setup, you might have limitations in terms of read or write access on files located outside of your project root.
Where did tracing derive from?
Tracing as a method of debugging a issue in the modern web on a server is not a recognized concept, or at least one that I’m aware of. Maybe it exists but not labeled “Tracing”. I’m sure there are debugging tools that cover the same or similar as I’m describing here, but in my 15 years of experience as a web developer, I haven’t seen the mentality, and guidelines behind the process described as I’m doing here. If anyone knows of any good light tools that accomplish the same or better, or know of any labeled philosophy covering a similar concept to this, please let me know. But my personal relationship with the concept of tracing goes all the way back to the days of flash. When after compiling your swf, you were given a developer panel where traces you had scattered throughout different parts of your code were outputted using the trace() method. I am basically attempting to create a similar experience and possibly expand upon it.
Different ways to work with Tracing
Tail
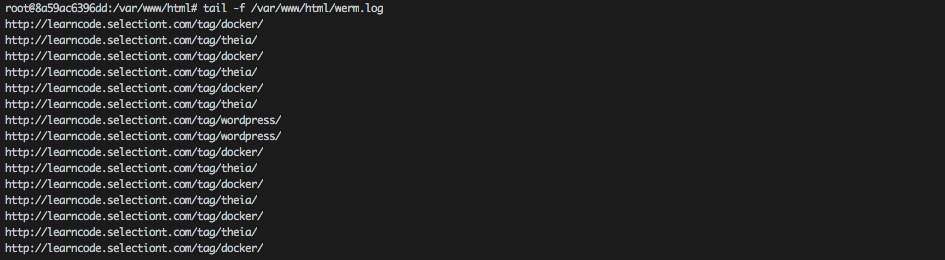
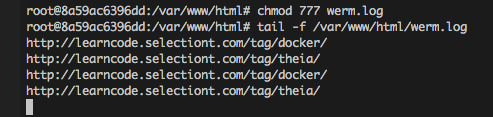
Since tracing creates and writes to a file, if terminal access is available, “tail” can be utilized to see its contents in realtime which in my opinion is ideal.
tail -f <project_path>/trace.loggiving you something similar to this
URL (Strict Limitations)
Because of strict limitations you might have on your server in terms of viewing your trace file, your only option is to view it through your browser via url. Since the file is written to the root of your project, for example trace/trace.txt, you should be able to access it using the url
http://<your domain>/trace/trace.txtDebugging on Production
Tracing also allows you to debug silently without having to kill the entire website. Imagine having to debug the live version of a site having no staging available to you while users are still navigating to the site. Some clients are in this situation and have a bug causing mayhem in a particular area that doesn’t require the entire site to be down. Tracing is like having console.log (Javascript) but on a server side language. I’ve gotten myself out of a lot of jams using tracing.
Do I smell a plugin or library?
I have a custom library that I currently use holding functions that help out immensely with debugging, but since its dependent on my framework, it wouldn’t work independent from it. But if I ever decide to decouple it, I’ll let you guys know. But for the time being, I created a simple version of that class. You can download it here if you’d like.
How to use
“enable_trace” is set to false by default. To overwrite that value, you can set it to true through the url or through code. To set through url, just simply add “enable_trace” as a GET variable with no value.
http://<project_url>/?enable_traceto enable through code
Trace::enable_trace = true;The trace file will be removed automatically for security reasons if enable_trace is set to false. To remove trace file manually (sort of like a refresh if you want to clear file), slap “remove_trace” as a GET var in your url.
http://<project_url>/?remove_traceBy default, the trace file will refresh if file size goes over 200KB. You can change this value by setting
Trace::$bytes_max = 5000;Here are the two functions Trace offers
t($output);Outputs strings and pretty printed objects
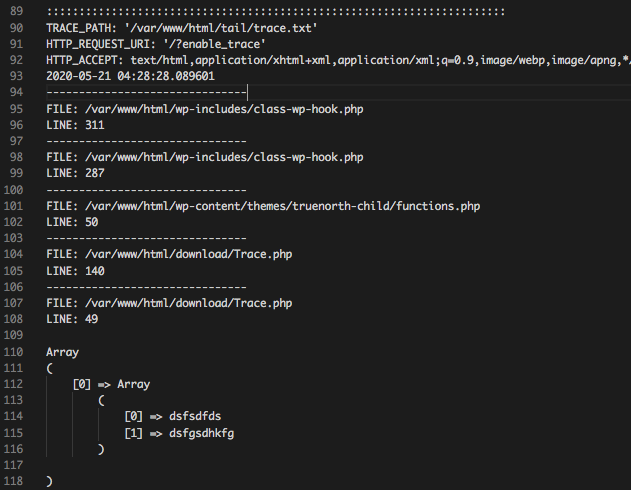
tsp($output, "tag");Only trace if input string includes a substring.
Previewing traces
to preview traces simply navigate to
http://<project_url>/trace/trace.txt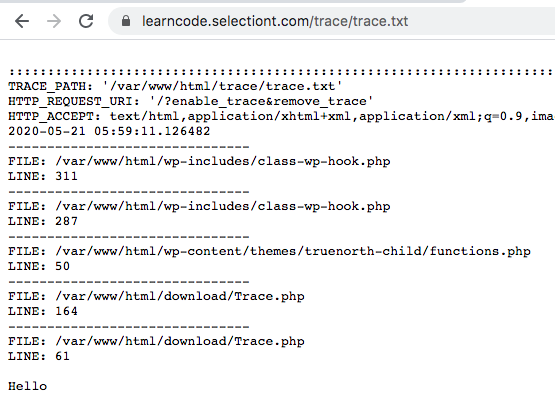
Or if you have terminal access, you can tail the file and see changes made to the file in realtime
tail -f <project_root>/trace/trace.txtTake it easy guys, stay safe and sharp.